Dashboards
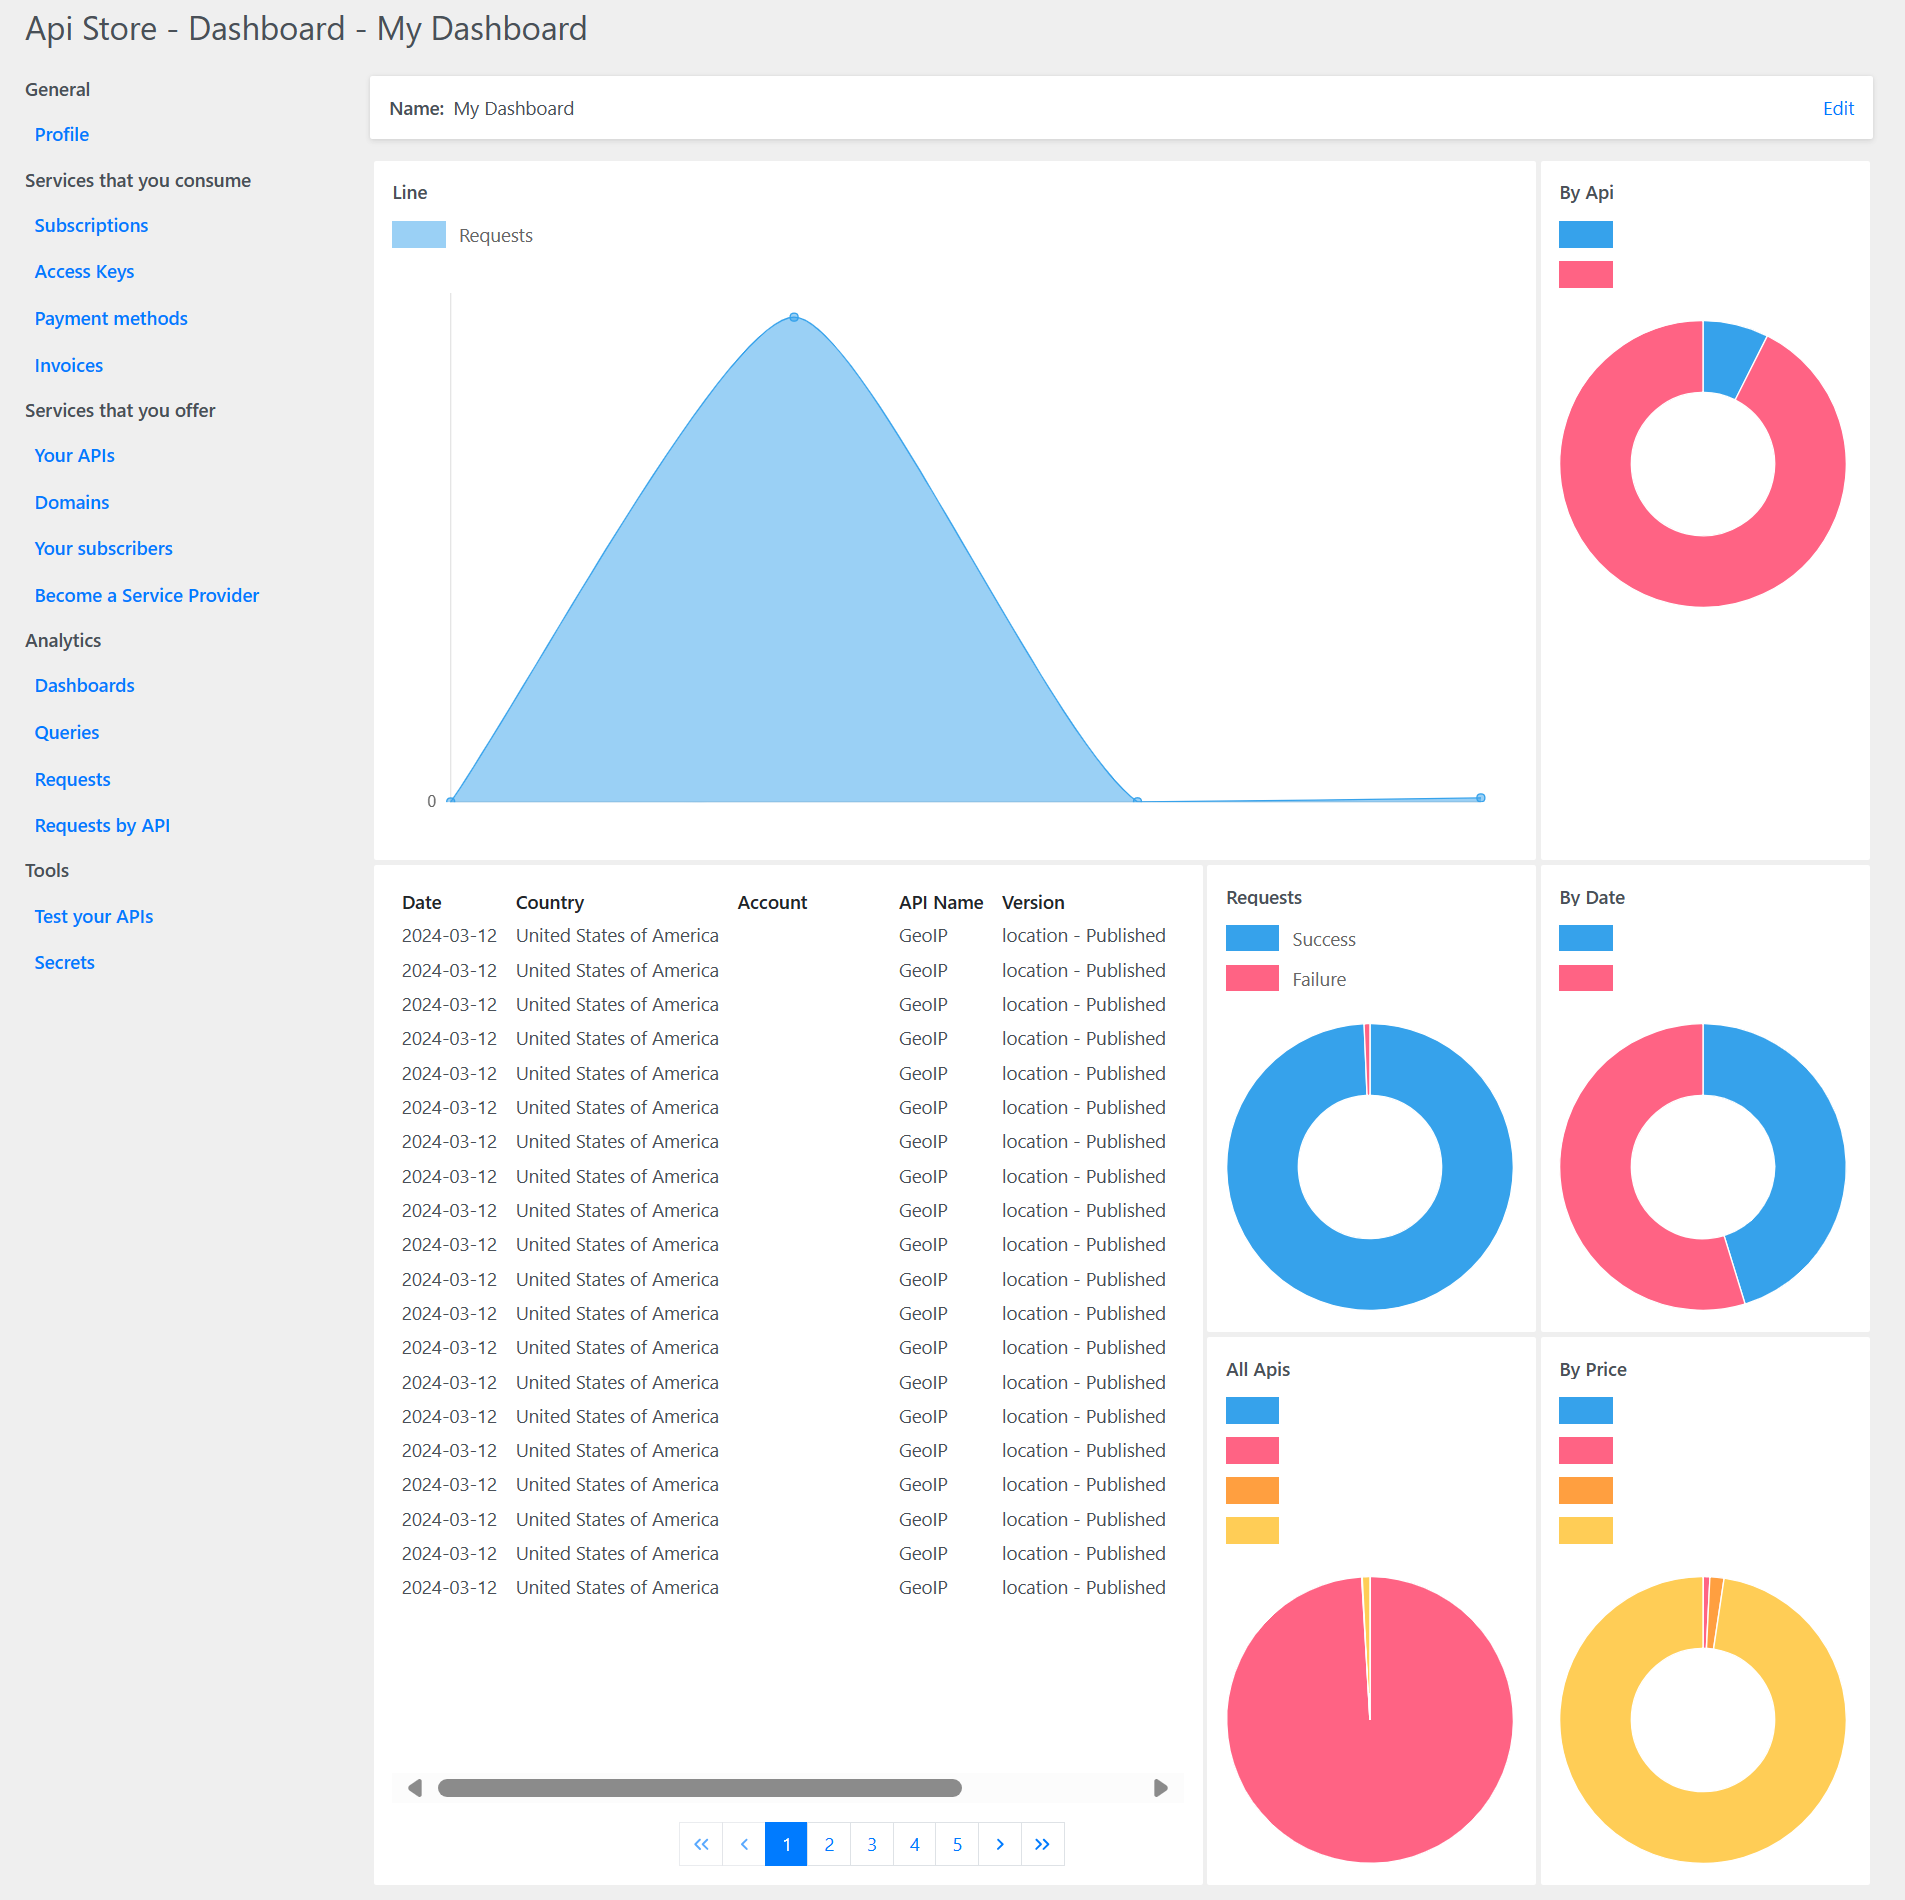
Dashboards are where your queries can be combined and visualized in a variety of ways. They provide a centralized space for you to monitor data, track key performance indicators, and make data-driven decisions.
Dashboards can include charts, graphs, and table elements to represent your data. You can customize your dashboard to display the most relevant data for your needs, and make informed decisions based on the data analysis.
The dashboards support real-time data updates, allowing you to see the most current data at a glance. This makes them an essential tool for your business and allows you to rely on up-to-date information:
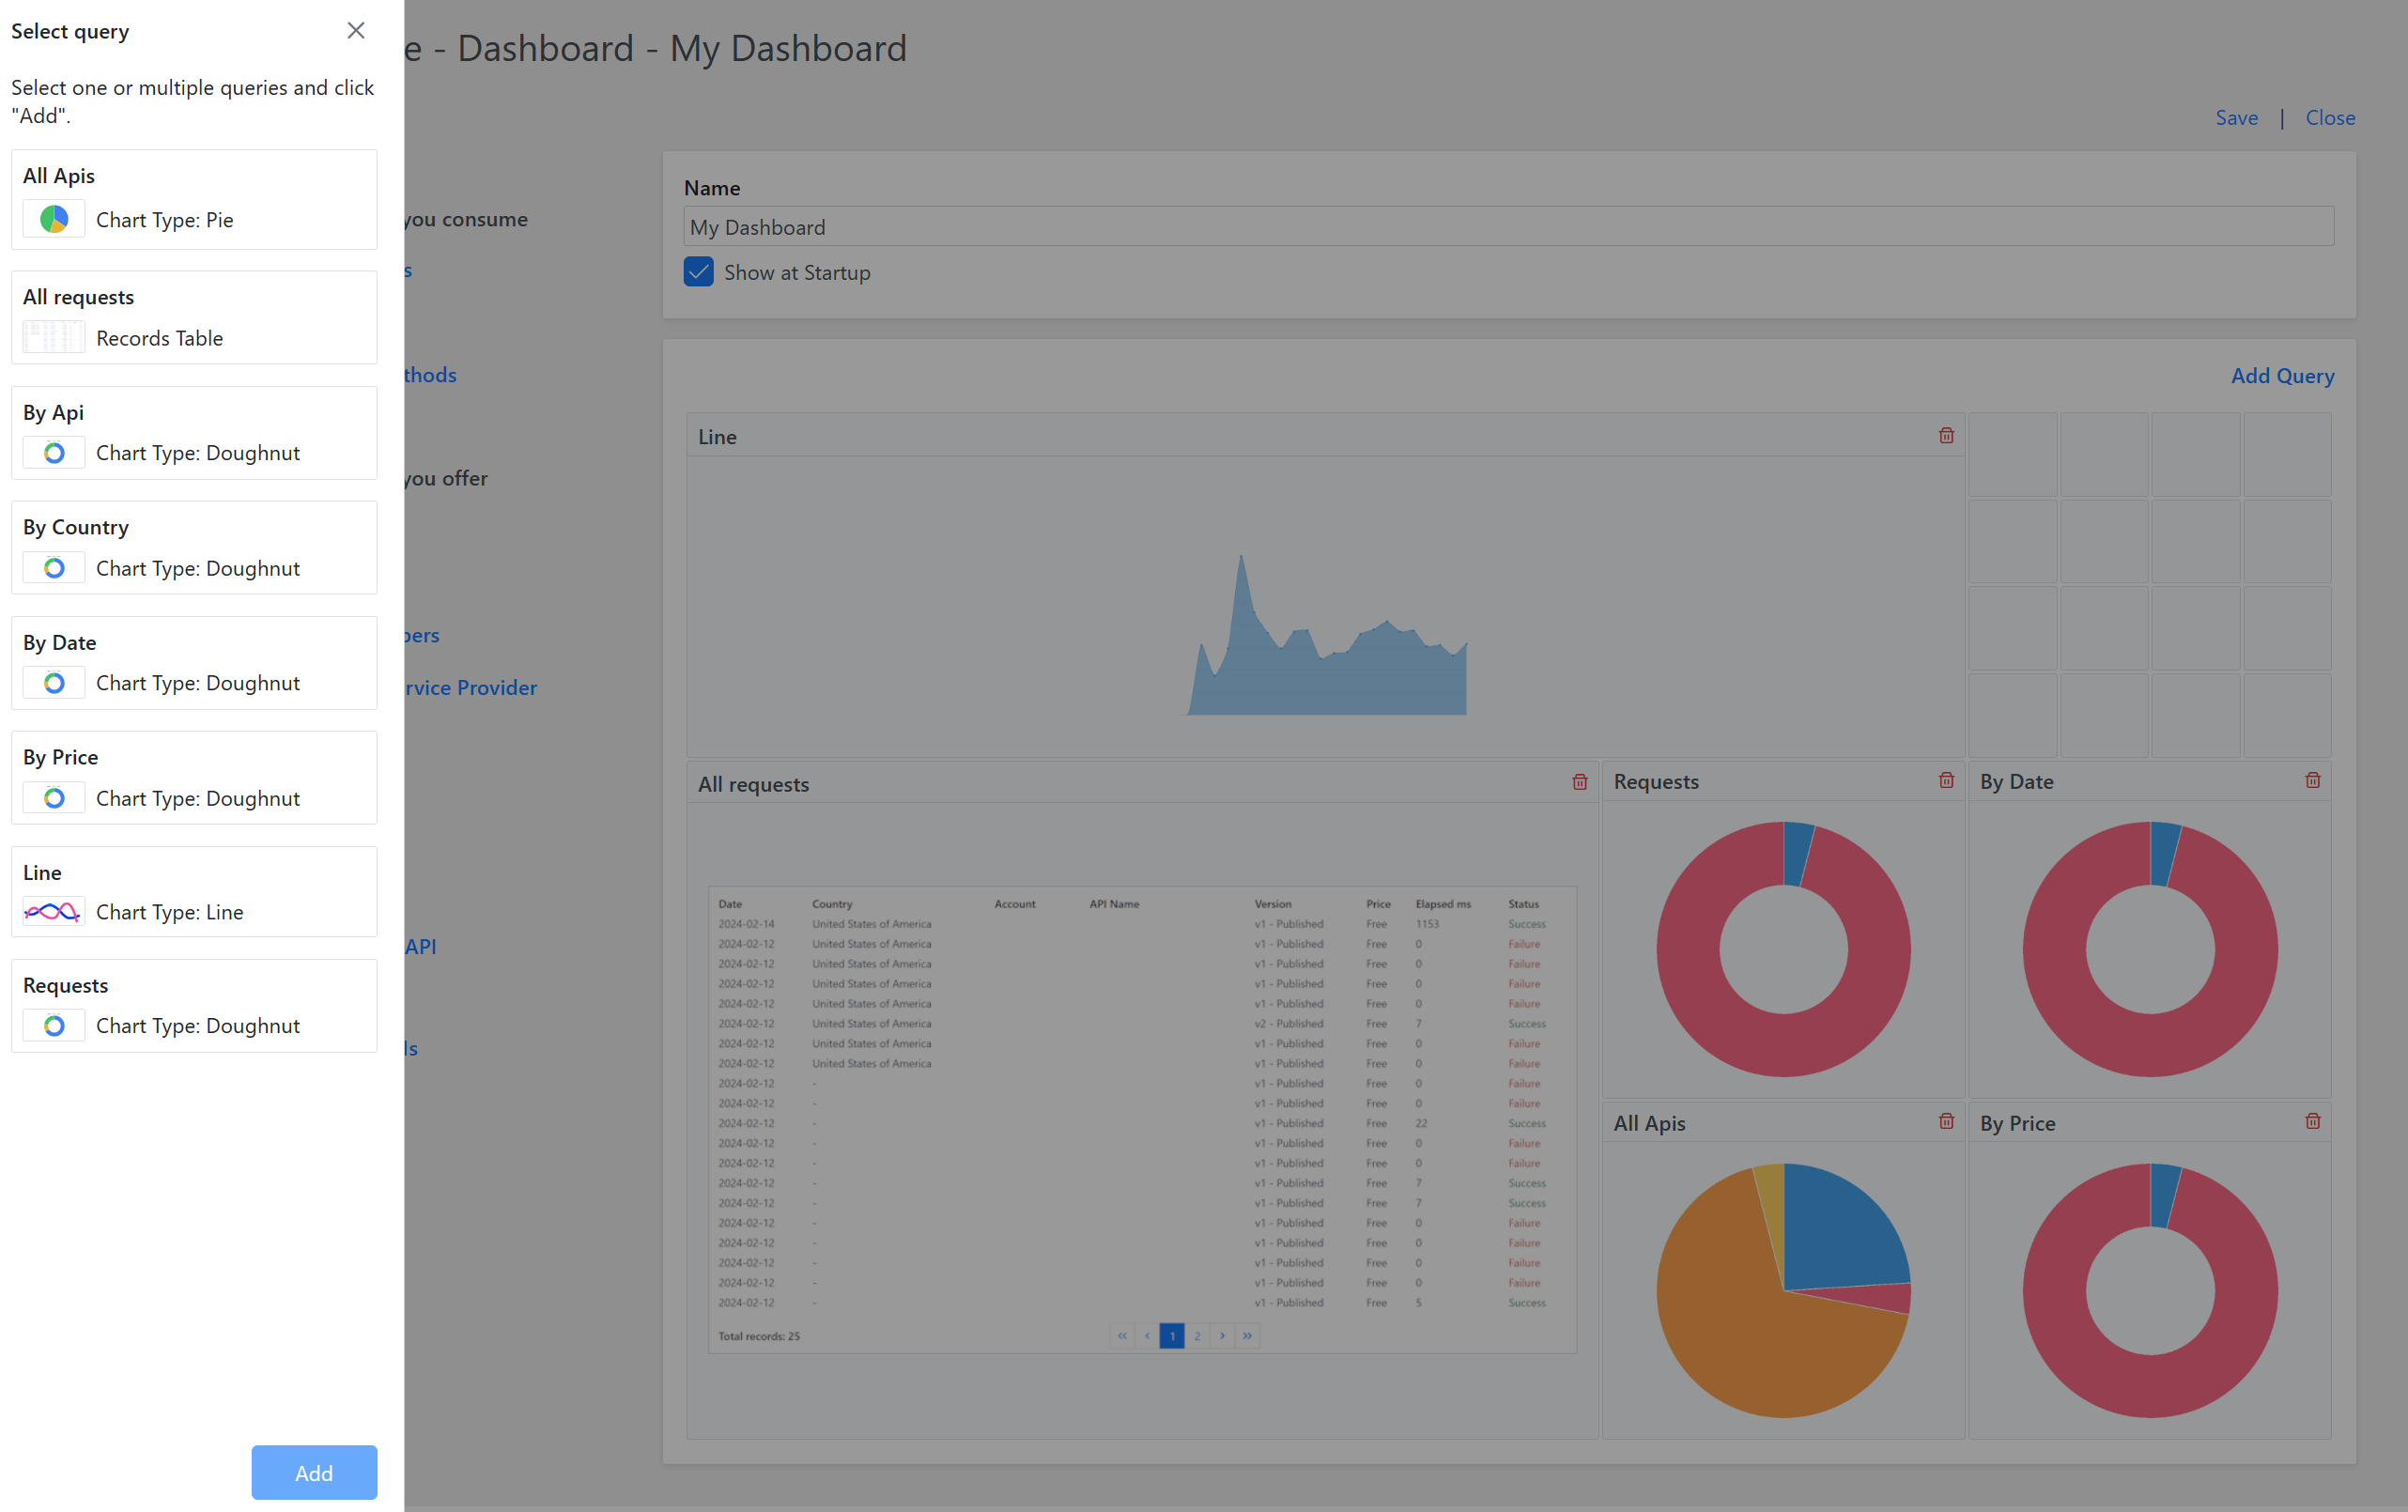
Editor
The Editor is a powerful tool that allows users to create, modify, and manage your dashboards.
With the Editor, you can add or remove queries, change the visual representation of your data (e.g., charts, graphs, tables), and adjust other settings to make your dashboard as informative and useful as possible.
The Editor also supports real-time updates, so any changes you make will be immediately reflected on your dashboard. This allows for quick and efficient data analysis, helping you make data-driven decisions with confidence: